Unmasking Your Home's Energy Vampires: A Practical Guide to Detecting and Eliminating Hidden Power Drain

There is a quiet drain happening in virtually every American home right now. It does not announce itself. It does not trip a breaker or slow a device. It simply accumulates—watt by watt, hour by hour—until it represents a meaningful slice of your annual utility bill. The culprits are phantom loads: the residual power consumption that persists in electronics and appliances even when they appear to be off or idle.
Rather than offering another general warning about standby power, this guide takes a hands-on approach. Think of it as a field manual for conducting your own phantom power audit—one that ends not just with awareness, but with a ranked action plan tailored to your specific home.
Why a Personalized Audit Matters More Than General Averages
The U.S. Department of Energy estimates that standby power accounts for roughly 5 to 10 percent of residential electricity use nationwide. For the average American household spending around $1,500 annually on electricity, that translates to somewhere between $75 and $150 disappearing silently each year.
But averages obscure individual reality. A household with three gaming consoles, a home theater receiver, and a nest of networked smart devices may be losing three or four times what a simpler setup loses. Conversely, a recently upgraded home with modern appliances might be well below average. The only way to know your actual exposure is to measure it directly.
Tool #1: The Plug-In Power Meter
The most accessible and immediately useful instrument in your audit toolkit is a plug-in power meter—sometimes called a watt meter or energy monitor. Devices in this category, available from most major electronics retailers for between $15 and $30, plug directly into a standard wall outlet. You then plug your device into the meter, and it displays real-time wattage draw along with cumulative kilowatt-hour consumption over time.
To conduct a proper audit, work through your home systematically:
- Measure standby state first. Power the device on, use it briefly, then switch it to its normal resting state (whether that is sleep mode, standby, or simply switched off at the device's own power button). Record the wattage reading after five minutes of stabilization.
- Measure active draw second. Power the device fully on and record peak consumption during normal operation. This gives you context for how significant the standby draw actually is relative to useful operation.
- Let the meter accumulate. For devices that cycle (such as a refrigerator or HVAC equipment), leave the meter connected for 24 hours to capture a realistic average.
Priority targets for your first pass include entertainment centers, home office setups, gaming consoles, cable and satellite boxes, and any device with an external power adapter or transformer.
Tool #2: Smart Plugs with Energy Monitoring
For ongoing visibility rather than a one-time snapshot, smart plugs equipped with energy monitoring capabilities offer a significant upgrade. These devices—available from several manufacturers at price points ranging from $15 to $40 per outlet—pair with smartphone applications to log consumption data continuously.
The practical advantage over a standalone meter is historical tracking. Rather than catching a device at a single moment in time, a smart plug builds a consumption profile across days and weeks. This is particularly valuable for identifying devices with erratic or time-dependent draw patterns—a network-attached storage drive that spins up at 2 a.m. for scheduled backups, for instance, or a smart TV that maintains a network connection long after the household has gone to sleep.
Many energy-monitoring smart plugs also allow you to set consumption thresholds and receive alerts, turning passive monitoring into an active notification system.
Tool #3: Whole-Home Energy Monitoring Systems
For homeowners seeking a comprehensive view rather than device-by-device investigation, whole-home energy monitors represent the most sophisticated audit option. Systems in this category install at the electrical panel and use current sensors on individual circuits to track consumption across the entire home simultaneously.
These systems provide a dashboard view of every circuit's real-time and historical draw, making it straightforward to identify which rooms or device clusters are the most significant contributors to baseline consumption. While the installation cost—typically between $300 and $500 for the hardware, plus potential electrician fees—places this option above casual experimentation, the data granularity it provides is unmatched.
Building Your ROI Ranking
Once you have collected wattage data across your devices, the next step is converting raw numbers into actionable priorities. The formula is straightforward:
Annual cost = Standby watts × 8,760 hours ÷ 1,000 × local electricity rate ($/kWh)
Using the U.S. national average electricity rate of approximately $0.16 per kWh as a baseline, a device drawing just 5 watts continuously in standby costs roughly $7 per year. A device drawing 20 watts continuously—common among older cable boxes, certain gaming consoles, and home theater receivers—costs closer to $28 annually from standby alone.
With per-device annual costs calculated, rank your findings from highest to lowest. Then assess the remediation cost for each:
- Smart plug or power strip with switched outlets: $15–$40. Appropriate for entertainment centers, home office clusters, and charging stations where manual switching is inconvenient.
- Advanced power strip with master-controlled outlets: $25–$60. Cuts power to peripheral devices automatically when a primary device (such as a television) powers down.
- Device replacement: Relevant when an aging appliance's standby consumption is dramatically higher than modern equivalents. Calculate the break-even timeline against the cost of replacement.
- Behavioral change (free): For devices where the solution is simply forming the habit of full power-down, the ROI is effectively infinite.
The Devices Most Likely to Top Your List
While every home differs, certain device categories consistently emerge as high-priority targets in phantom power audits:
Cable and satellite set-top boxes remain among the worst offenders in American homes, frequently drawing 15 to 30 watts continuously regardless of usage state. Many never fully power down because they are designed to receive software updates and guide data at all hours.
Older gaming consoles, particularly those configured to remain in network-connected standby for automatic downloads, can draw 10 to 15 watts around the clock. Adjusting update settings to manual-only and enabling deeper sleep modes can reduce this substantially.
Home theater receivers and soundbars with network connectivity often maintain active processor states to preserve instant-on responsiveness, at a cost of 5 to 20 watts in standby.
Desktop computers and monitors left in sleep rather than fully powered down can draw 3 to 10 watts each—modest individually, but significant in a multi-device home office setup.
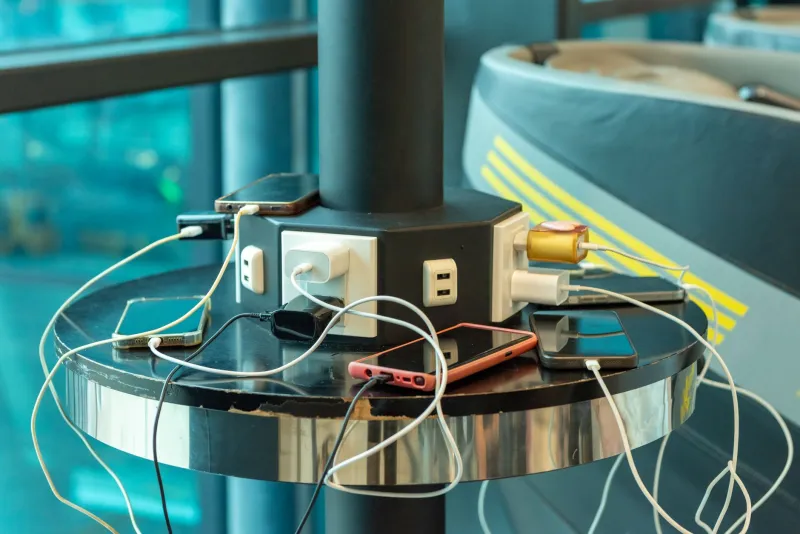
External power adapters for devices no longer in active use continue drawing 0.5 to 2 watts simply by remaining plugged in, even without a connected device.
Turning Detection Into Discipline
The most valuable outcome of a phantom power audit is not the immediate savings—though those are real and cumulative. It is the shift in perspective from passive consumer to active manager of your home's energy infrastructure. When you have measured your own devices and seen the numbers, the abstract concept of standby drain becomes a concrete, addressable problem.
Schedule a brief re-audit annually, particularly after adding new devices to your home. Technology evolves, consumption patterns change, and the landscape of your personal tech stack rarely stays static for long. The tools exist. The methodology is straightforward. The only remaining variable is whether you take the first measurement.